

The Pages and Screens report in Google Analytics 4 (GA4) is very useful that can help you understand how users interact with your website or app. This GA4 report shows you the pages and screens that people visit, as well as how long they spend on each page or screen. You can also use this report to track the performance of different pages and screens over time.
To access the Pages and Screens report, go to the Reports tab in your GA4 property Screenshot Given below


Select Engagement > Pages and screens.


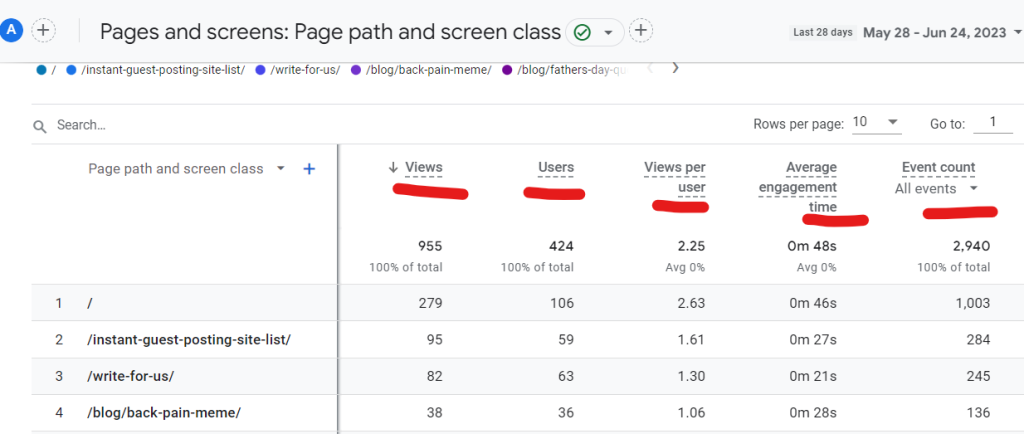
The Pages and Screens report includes the following metrics:
- Views: The number of times a page or screen view.
- Users: The number of unique users who view a page or screen.
- Views per user: The average number of times a page or screen view by a unique user.
- Average engagement time: The average amount of time a user spent on a page or screen.
- Unique user scrolls: The number of unique users who scrolled down a page or screen.

You can use the filters in the Pages and Screens report to drill down into the data and see how different pages and screens perform. For example, you could filter the data by device type, traffic source, or user segment.
Also Read: Default Channel in GA 4
You can also use the comparisons feature in the Pages and Screens report to compare the performance of different pages and screens. This can be helpful for identifying which pages and screens are most engaging with your users.
Also Read: What is Engaged Sessions in GA4 ?
The Pages and Screens report is a valuable tool that can help you improve the user experience of your website or app. By using this report, you can identify which pages and screens are most popular with your users and make changes to improve their engagement.
Also Read: Google Analytics 4 (GA4) Glossary
Here are some additional tips for using the Pages and Screens report:
- Use the filters to drill down into the data. The filters in the Pages and Screens report can help you see how different pages and screens perform in different segments of your audience. For example, you could filter the data by device type, traffic source, or user segment.
- Use the comparisons feature to compare different pages and screens. The comparisons feature in the Pages and Screens report can help you identify which pages and screens are most engaging with your users. For example, you could compare the performance of your homepage to the performance of your product pages.
- Track the performance of pages and screens over time. The Pages and Screens report shows you how the performance of different pages and screens changes over time. This can help you identify which pages and screens are becoming less popular with your users, so you can make changes to improve their engagement.
Also Read: All About GA 4 Events
The Pages and Screens report is a powerful tool that can help you improve the user experience of your website or app. By using this report, you can identify which pages and screens are most popular with your users and make changes to improve their engagement.