


Understanding dimensions and metrics is crucial for extracting actionable insights from Google Analytics 4 (GA4). These core components structure every report in GA4, providing both qualitative and quantitative perspectives on user behavior. Dimensions describe the attributes of your data, while metrics quantify these attributes. This blog explores dimensions and metrics, their valid combinations, and how calculations and attribution models enhance reporting in GA4.
What Are Dimensions and Metrics in GA4?
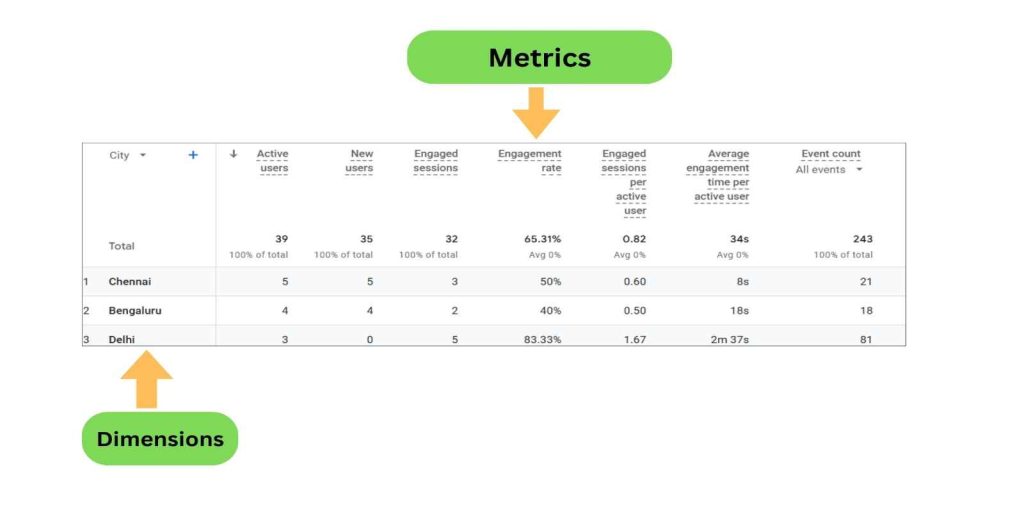
Dimensions
Dimensions are attributes or descriptive labels in your data.
Examples:
- City: Identifies the city where the user originated (e.g., “Chennai” or “Bengaluru”).
- Page URL: Specifies the URL of the visited page.
- Country : Identifies the country where the Active users originated
Metrics
Metrics are quantitative measurements used for analysis.
Examples:
- Active User : The total number of active users.
- Sessions: The total number of user sessions.
- Pages/Session: The average number of pages viewed per session.

Dimensions and Metrics in GA4 Reports
Structure in GA4 Reports
GA4 organizes reports using tables where:
- Dimensions are rows.
- Metrics are columns.
Example 1: Single Dimension with Metrics
| Dimension | Metric: Sessions | Metric: Pages/Session |
|---|---|---|
| Tokyo | 8,000 | 3.65 |
| Paris | 6,000 | 4.12 |
Adding Secondary Dimensions
Adding a secondary dimension refines your data analysis.
Example 2: City and Device Combination
| Dimension: City | Dimension: Device | Metric: Sessions | Metric: Pages/Session |
|---|---|---|---|
| Tokyo | Mobile | 5,000 | 3.2 |
| Tokyo | Desktop | 3,000 | 4.8 |
| Paris | Mobile | 4,000 | 4.0 |
Valid Dimension-Metric Combinations
Each dimension and metric pair must share the same scope.
- User-level scope: Metrics like Active Users work with dimensions like User Type.
- Session-level scope: Metrics like Sessions pair with dimensions like Source or Medium.
- Hit-level scope: Metrics like Pageviews align with hit-level dimensions like Page Title.
How Metrics Are Calculated in GA4
GA4 calculates metrics in two ways:
- Overview Totals
- Example: Total pageviews across all users.
- Qualified by Dimensions
- Example: Pages/session broken down by City.
Example 3: Time on Site Calculation
| User Type | Language | Avg Time On Site |
|---|---|---|
| All Users | All | 4:20 |
| New Users | English | 5:05 |
| Returning Users | Spanish | 6:15 |
Also Read: How to Find New User and Returning User in GA4 ?
Attribution Models in GA4
GA4 uses distinct attribution models to assign values to metrics based on specific goals and user actions.
1. Per Request Attribution
- Tracks metrics/dimensions for each user action.
- Example: Analyzing the page URI for every request.
2. Page Value Attribution
- Assigns value to a page based on forward-looking goals or revenue.
Example 4: Page Value Attribution
| Page | Revenue/Goal Value |
|---|---|
| Home | $50 + Goal 1 |
| Product | $30 + Goal 1 |
| Cart | $20 |
| Thank You | $0 |
3. Site Search Attribution
- Attributes value to the last search term before a conversion.
Example 5: Site Search Attribution
| Search Term | Revenue/Goal Value |
|---|---|
| “Shoes” | $15 |
| “Bags” | $25 |
Key Takeaways
- Dimensions provide descriptive context, while metrics measure activity quantitatively.
- Ensure valid dimension-metric pairings by matching scopes (e.g., session-level or hit-level).
- Attribution models like Page Value Attribution and Site Search Attribution help assign specific value to user actions.